
Metrics
Coolify displays CPU and memory history collected by Sentinel. Server charts show total CPU and memory usage, while resource charts show the usage of an individual application or standalone database container.
What metrics are available
Before you enable metrics
- Use a validated, non-Swarm server that is not configured as a build server.
- Enable and sync Sentinel on that server.
- Allow enough disk space on the connected server for the sampling rate and retention period you configure.
Enable metrics
Metrics are enabled at the server level and use the Sentinel container already assigned to that server.
Select the server
Open Servers and select the eligible connected server.
Open the Metrics page
Open Configuration > Metrics and select Enable Metrics.
Wait for Sentinel to restart
Coolify saves the setting and restarts Sentinel with the metrics collector enabled. The collector then begins storing server samples and samples for supported running resources.
Confirm that metrics are available
Wait for the CPU Usage and Memory Usage charts to begin showing data.
If Sentinel is disabled, the Metrics page directs you to enable it first. Enabling metrics starts Sentinel when the server is eligible.
View metrics
Server and resource charts use different memory units.
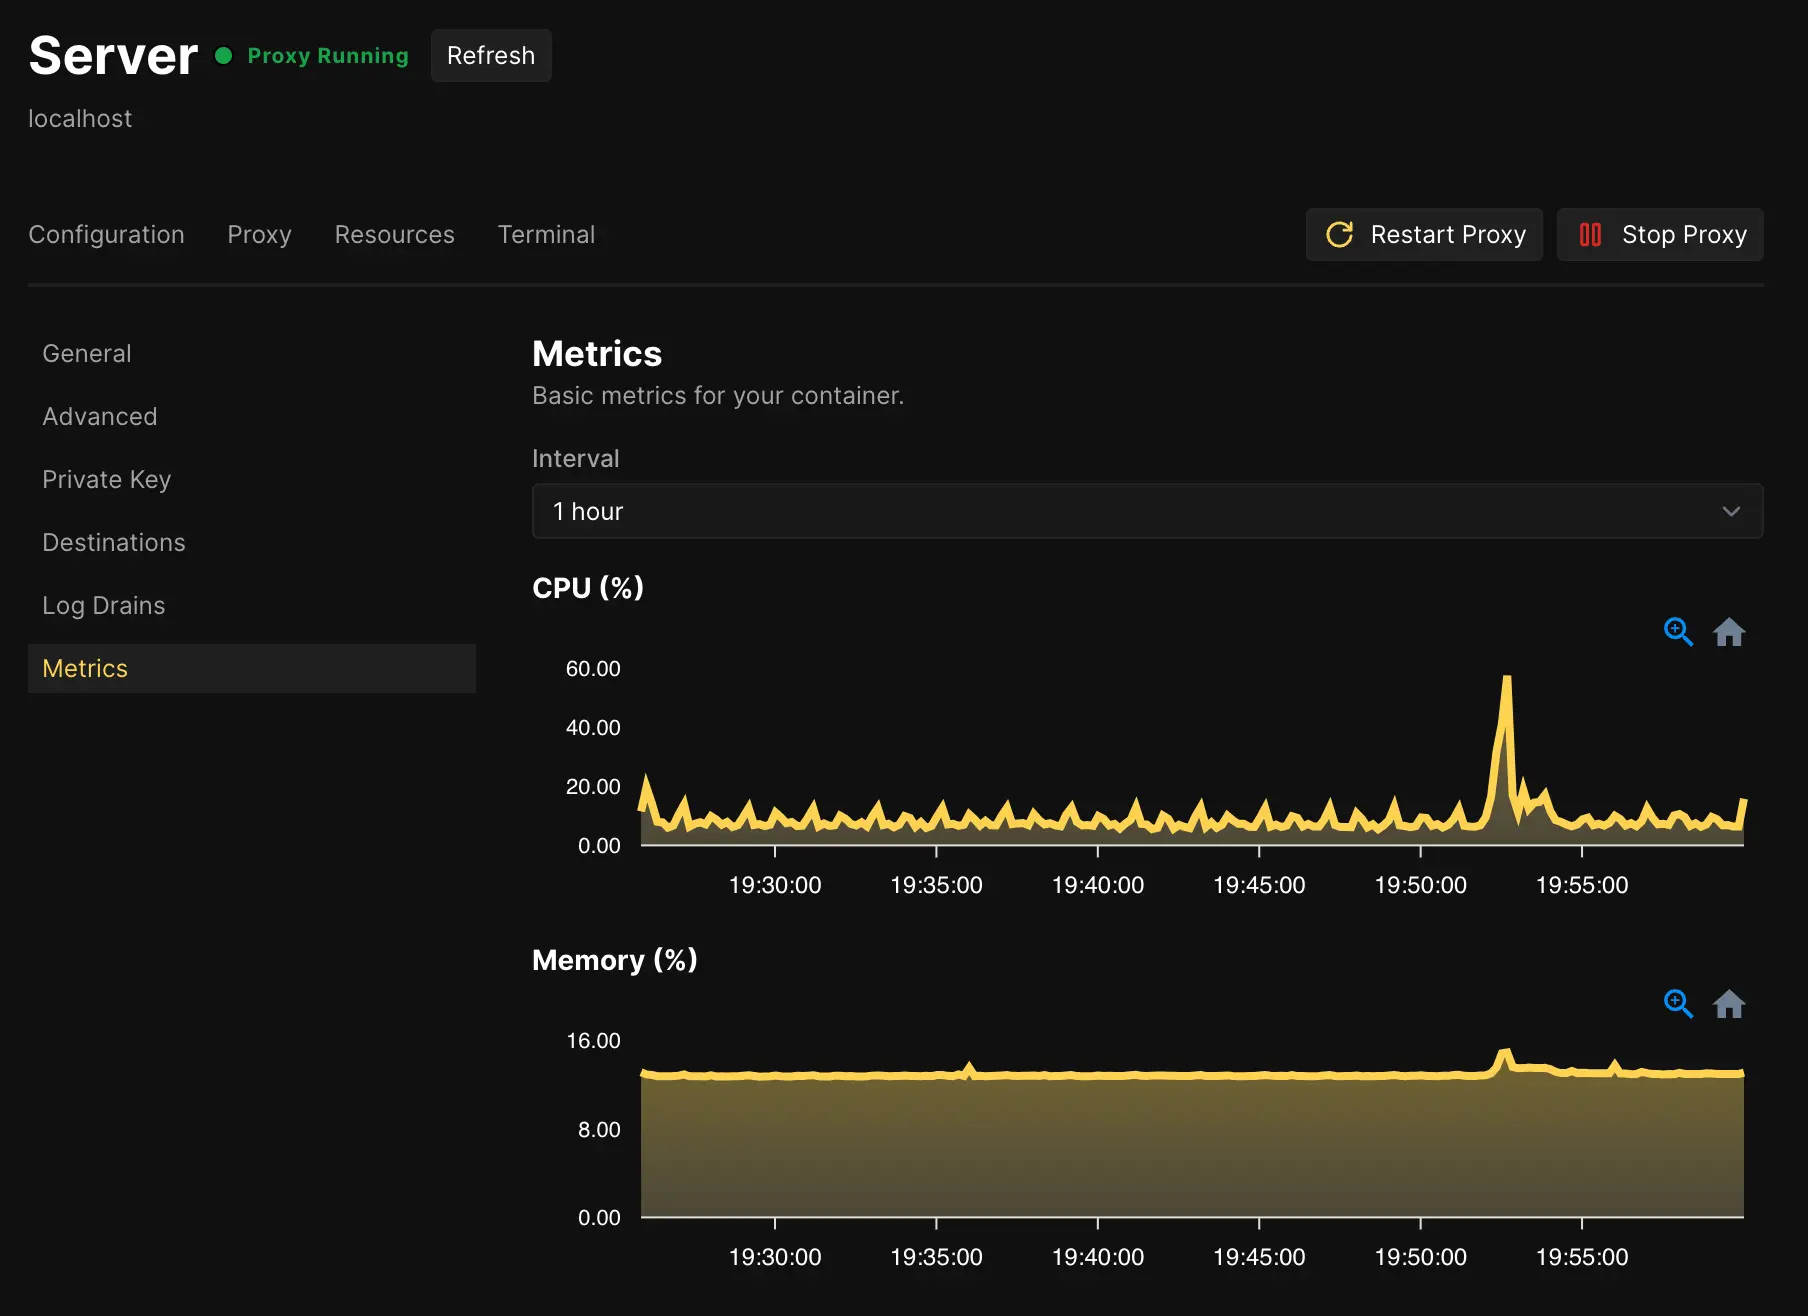
Server metrics
Open Servers > [server] > Configuration > Metrics.
- CPU Usage is the percentage of total server CPU in use.
- Memory Usage is the percentage of total server memory in use.
The Metrics page offers these time ranges:
- 5 minutes and 10 minutes, with live refresh
- 30 minutes
- 1 hour
- 12 hours
- 1 week
- 30 days
The live ranges ask Coolify for new chart data every five seconds. The Sentinel sampling rate determines how often a new metric point is available.
Sampling and retention
Open Servers > [server] > Sentinel > Configuration to change these values:
- Metrics rate (seconds) controls the collection interval. The default is
10, and the minimum is1. - Metrics history (days) controls local retention. The default is
7, and the minimum is1.
Sentinel stores this history under /data/coolify/sentinel on the connected server. A lower collection interval creates more points and uses more disk space.
The chart can offer a longer range than the retained data. For example, a 30-day chart shows only the available history when Metrics history (days) remains at its seven-day default.
Disable metrics
Open the server Metrics page and select Disable Metrics. Coolify restarts Sentinel with the collector disabled.
Disabling metrics does not disable Sentinel itself. Server heartbeats, container state, health information, and disk usage reporting can continue without CPU and memory history.